This is nothing that is as sophisticated as the title might suggest. It’s just that I got a free trial to a data visualisation software called “Tableau”, so what better data to play on it with than ASL data?
First, I took Tom Kearney’s excellent “Master ASL Scenario Listing III” from the Texas ASL website.

1944 wins out. We got a couple of ETO scenarios at around 1919!
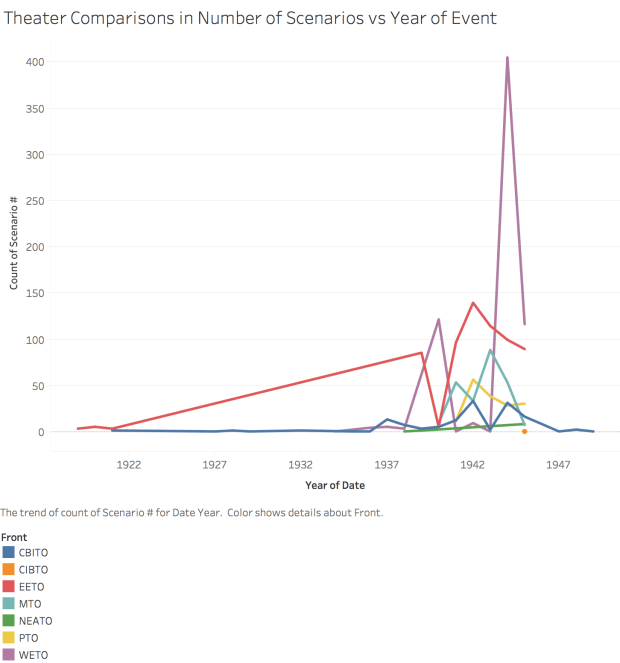
We clearly have a lot more Western post-Normandy scenarios. “MTO” is the Mediterranean, in case you are wondering, this theater comes in 3rd in front of PTO.

The tall blue line is of course Avalon Hill / MMP. What caught my also is the very long (light blue) lead that Le Franc Tireur (LFT) has early in time. We are probably talking about their Russian Revolution scenarios here. The red line running along LFT is Dispatches from the Bunker (DB) and the orange Bounding Fire Productions (BFP).
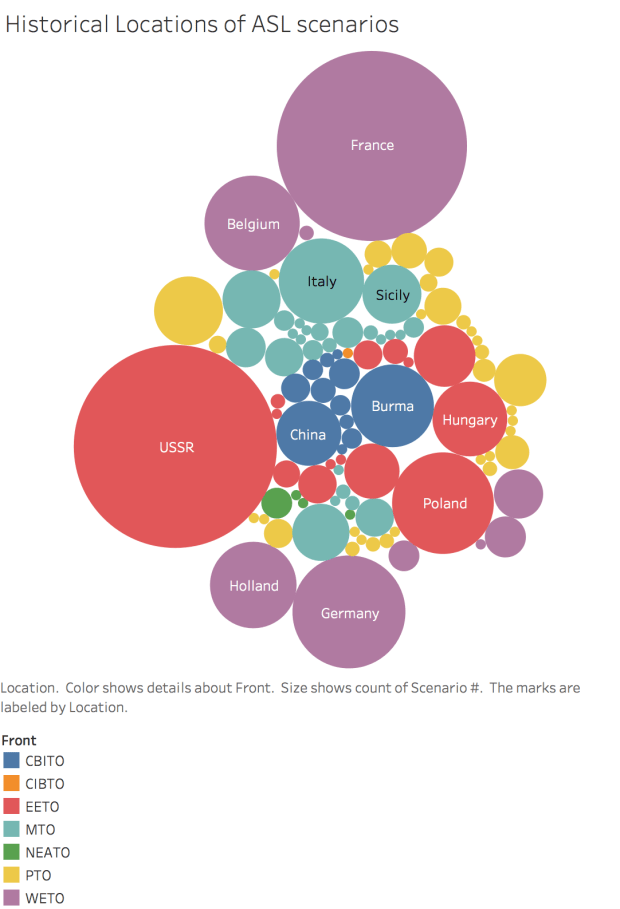
No surprises here for the most part, but I didn’t know we have that many scenarios on events that took place in the Philippines!
The following are the Nationalities featured by different Publishers, ie get BFP if you want to play more Chinese OB, BFP & SP for more IJA (assuming that we all get core modules by default).


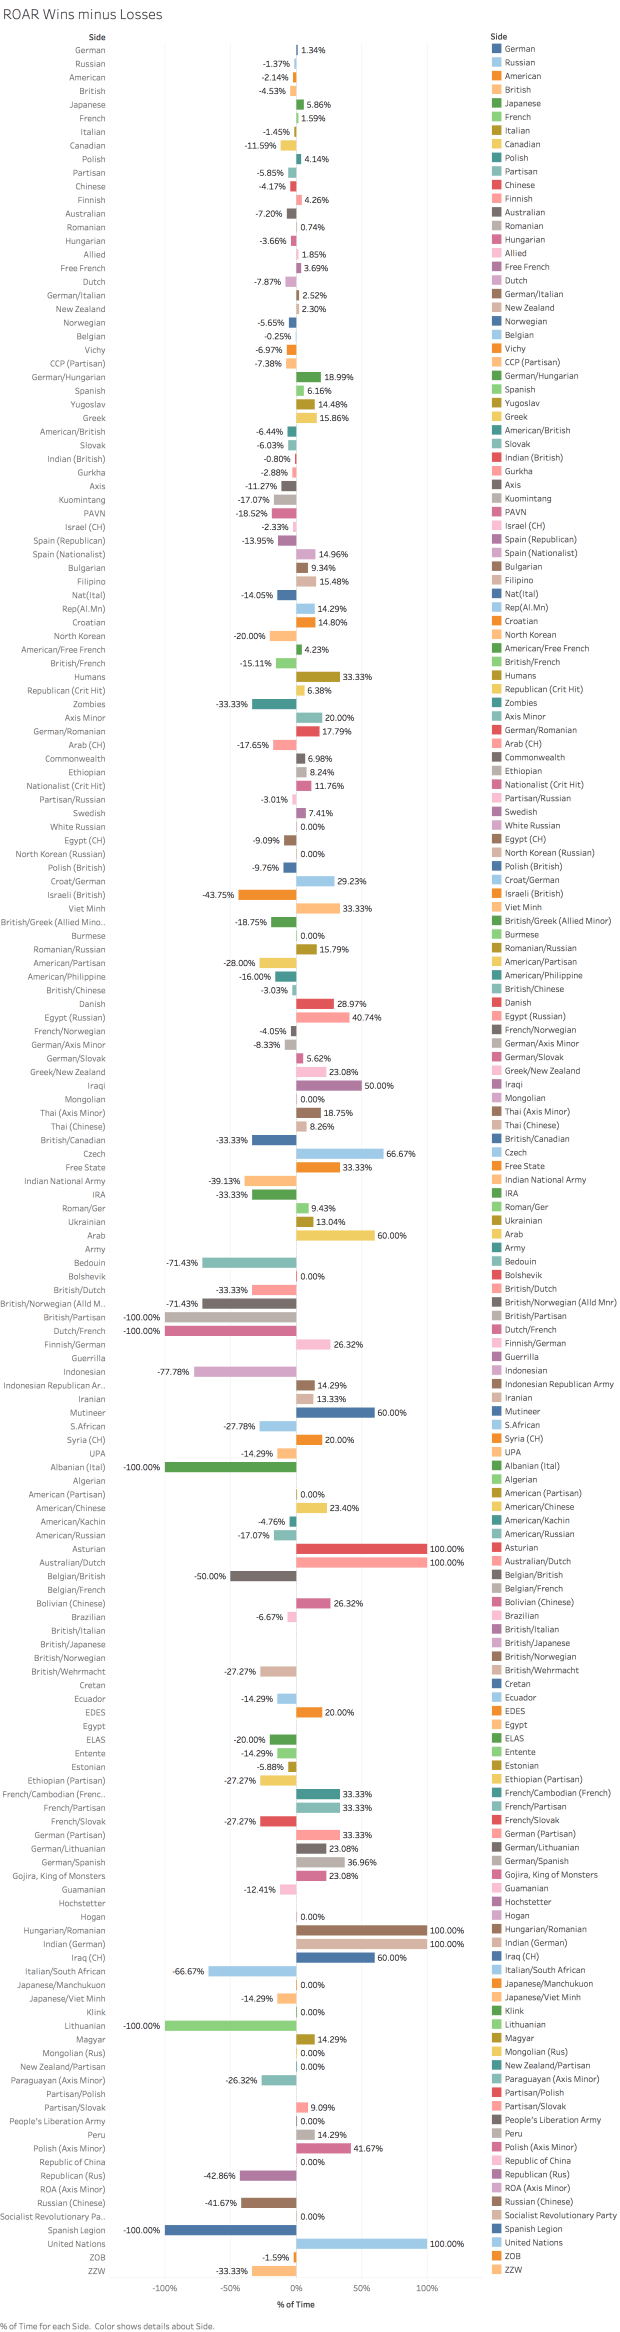
Finally I took the 100.000+ records we accumulated on ROAR and worked out the Percentage of Wins minus Losses per Nationality. (Get the IJA, don’t take the Canadians .. )
Again, I am a novice when it comes to the science of Data Analysis, so please take everything with a grain of salt. It certainly interests me though! I hope this is entertaining for you as well.

Interesting. In the breakdown by front, what’s the difference between CBITO and CIBTO?
Heya Paul!! Just checked – it’s the same. (Typo)
Thanks for posting this. V interesting. I am surprised that in ’44 there are that many more Western Front ETO scenario than Eastern front…
Heya Milton – I thought it is fun as well. Thanks for visiting!